


Imagine yourself walking down the road during a rainy day. You donned a raincoat and held an umbrella only to realize that you landed into a pothole. You take a deep sigh and make a small jump forward to get out of the pothole. Problem solved, Hurrah! But, what if the pothole was further deep? It would have taken considerably more effort to get out of it. Worst case – some people might have to call for help and get you rescued. The point is that: the bigger the hole, the higher the effort to get out of it.
Well, if you haven’t guessed the analogy already, the pothole signifies the drawdown. The deeper the drawdown gets, the higher your strategy must perform to get out of it. For the uninitiated, drawdown is a measure of risk that tells the amount of loss the strategy carries since it started to decline from its peak. Let us look at some surprising numbers:
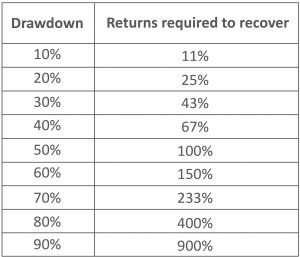
Disclaimer/Source: MOAMC Research
The above table reveals that you need to earn significantly higher returns for the same incremental increase in drawdown. Therefore, if you control your portfolio drawdown, it is easier to recover and, hopefully, make a new portfolio high.
For many investors, the performance metrics of any strategy has been limited to just annualized returns, and a few may additionally look at annualized volatility. No doubt, these are imperative to consider before investing. However, a few other metrics tell you more about the nature of any investment strategy. One such key statistic is drawdown, whose importance is generally undervalued in the investor’s community. Some people look at the maximum drawdown, which is the difference between the highest and lowest points of the strategy. Historically, it has occurred during crisis periods like the GFC of 2008, the Covid-19 outbreak, etc. But what about the majority of the time when the market is not experiencing any crisis? How much time does your portfolio spend in a drawdown of, let’s say, 5%, 10% or 20%? Hold that thought!
Let me highlight the psychology behind why people overestimate their willingness to take risks, especially when experiencing drawdown. You may encounter a lot of high-risk strategies on social media earning higher returns than your portfolio, but what if I tell you that risky strategy at some point in time fell up to 70% to deliver those high returns? Do you have the stomach to see such a sharp fall in your portfolio? Numerically speaking, suppose if you had put in Rs 10 lakh in any risky scheme, it came down to Rs 3 lakh before going up till Rs 15 lakh. Does this journey of high returns fit well with your mental peace? Do you think you will be able to hold onto the risky scheme when it is plunging? You might act irrationally -panicking and exiting investment at its low point, leading to permanent erosion of capital. We are, after all, emotional beings, and the sooner we embrace it, the better for our portfolio.
Remember I asked you to think how much time a strategy spends in a drawdown of different magnitudes; let us look at some numbers.
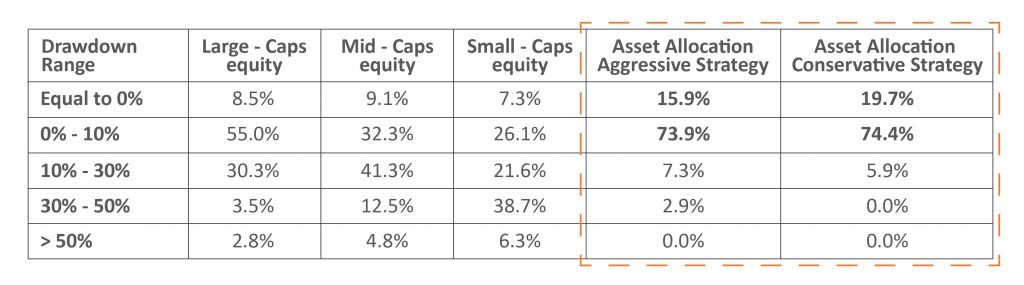
Disclaimer/Source: MOAMC Research, NSE; Performance Data as of close of 29 Dec 2006 – 31 Dec 2021. Large-Cap: Nifty 50 TRI, Mid-cap: Nifty Midcap 150 TRI, Small-cap: Nifty Smallcap 250 TRI, Asset Allocation – Aggressive (Higher weight to equity and lesser to Debt along with gold); Asset Allocation – (Higher weight to debt and lesser to Equity along with gold).
Understanding a Drawdown
The above table shows us the time spent by the strategy in different drawdown buckets in the given period. Note that the asset allocation strategy has spent most of its time in low drawdown buckets (more than 85% of the time). In comparison, other equity strategies have even gone to a drawdown beyond 70%. Even asset allocation strategies’ zero drawdown days are roughly double that of other plain vanilla equity strategies. Most of us only see the magnitude aspect of the drawdown. However, time drawdown is also an essential factor to consider. Historically, Small caps spent roughly 1/3rd of the time in 30% – 40% drawdown. It is painful to experience the drawdown, especially for those monitoring their portfolios regularly.
Risks of Drawdown
Investors can minimize the investment risk posed by potential drawdowns by utilizing asset allocation in their investment portfolio. Below is a table that shows the maximum historical drawdown suffered by the strategies discussed and the time (in months) it took to break even the previous peak.

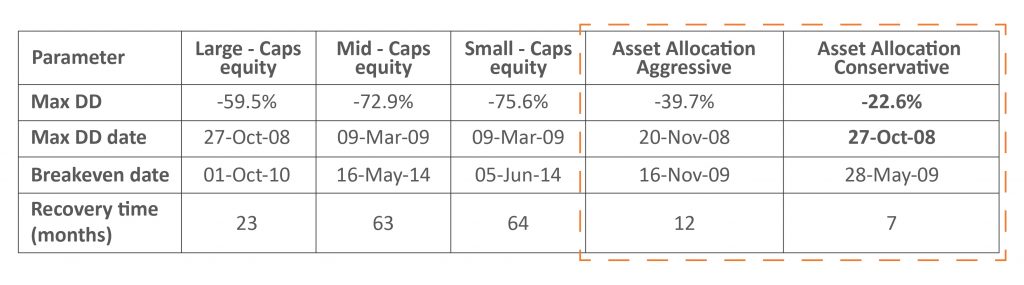
Disclaimer/Source: MOAMC Research, NSE; Performance Data as of close of 29 Dec 2006 – 31 Dec 2021. Large-Cap: Nifty 50 TRI, Mid-cap: Nifty Midcap 150 TRI, Small-cap: Nifty Smallcap 250 TRI, Asset Allocation – Aggressive (Higher weight to equity and lesser to Debt along with gold); Asset Allocation – (Higher weight to debt and lesser to Equity along with gold).
It is evident that the magnitude of maximum drawdown in asset allocation strategies is relatively reduced. However, the recovery time is significantly lesser than plain vanilla equity-based strategies.
The less time spent by the strategy in steep drawdowns ensures continued investing and stickiness to the plan. It re-enforces the power of asset allocation as a core principle in our financial journey. Most people only look at the destination and tend to ignore the journey. The success of your financial goal is only as good as how well you stick with the plan. Understanding these practical nuances of investing and your own behavioural biases can help meet their expectations and achieve their financial goals.
Author: Devanshu Tayal, Senior Executive, Analyst
Co-author: Pratik Oswal, Head, Passive Funds
Disclaimer: This article has been issued on the basis of internal data, publicly available information and other sources believed to be reliable. The information contained in this document is for general purposes only and not a complete disclosure of every material fact. The stocks/sectors mentioned herein is for explaining the concept and shall not be construed as an investment advice to any party. The information / data herein alone is not sufficient and shouldn’t be used for the development or implementation of any investment strategy. It should not be construed as an investment advice to any party. All opinions, figures, estimates and data included in this article are as on date. The article does not warrant the completeness or accuracy of the information and disclaims all liabilities, losses and damages arising out of the use of this information. The statements contained herein may include statements of future expectations and other forward-looking statements that are based on our current views and assumptions and involve known and unknown risks and uncertainties that could cause actual results, performance or events to differ materially from those expressed or implied in such statements. Readers shall be fully responsible/liable for any decision taken on the basis of this article. Investments in securities markets are subject to market risks, read all the relevant documents carefully.
.


