


Dear Investor,
In this edition let us discuss the following topics:
- Premiumization as an investment theme
- Discussion on valuation: Whether it is right to be cap focussed? How much is the impact of growth on valuation?
- Focus on risk
- Our portfolio positioning in the new fiscal
In the last edition, we discussed the China+1 theme and if it is working. In this edition let us look at the premiumization theme.
Higher incomes have driven consumption in India over the last decade. Middle-class households, which now represent over 30% of the population, has enjoyed strong annual growth from 1995-2021, leading to the bulk of the expansion in premium categories. With the growth of the economy, the growth in the middle class is expected to continue and this could provide a fillip to this trend. In percentage terms, the increase in the number of rich and super-rich households has been larger vs other spaces. Savings during Covid and changed outlook towards savings vs celebrating the present have further provided tailwinds. As a result, growth in premium products has expanded at a faster pace than mass-market equivalents across various categories, notably in consumer, autos and real estate. While the trend was visible and anticipated earlier, there were very few companies to invest to benefit from the trend because the overall space was very nascent and companies were very small.
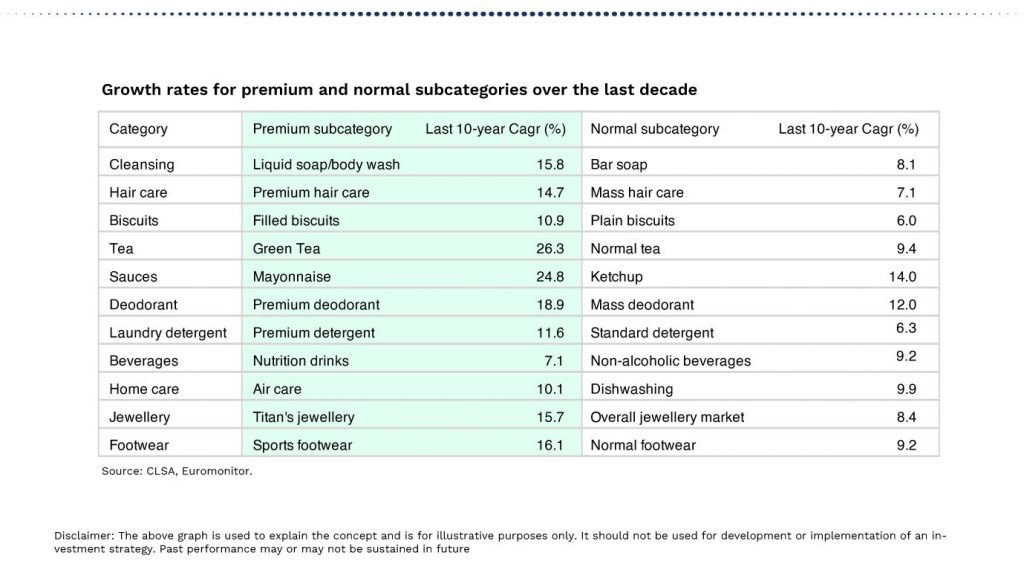
This trend is seen in various spaces. In consumers for example, the trend is seen in Jewellery, toothpaste, foot-wear, soap, biscuits, detergents and other categories. In these categories, the growth in premium products is nearly 2X the growth of the entry level counterparts.
In autos, the trend is towards more expensive SUVs, deluxe motorcycles and now more towards EVs and hybrids (which are more expensive). Manufacturers who had a larger share of these categories have done relatively better.
Premiumization trend is visible in property markets as well. Sale of premium segment (over Rs10mn) has increased sharply. Share of premium apartments in total sales has increased from 18% to 30% over 2019-2022. The average home purchase ticket size also went up over the same period.
Let us discuss valuations
Discounted cash flow is theoretically the best method to value a business (while it does suffer from difficulties of long period projection). It basically says that if all future cash flows of a business is discounted back at the required rate of return of an investor, the present value of the enterprise (appropriate for the investor) would be obtained. If the price is higher than the present value then the investor should hope to make less than his required rate of return and vice-versa.

Let us look at sensitivity of valuations in an example where we project for just 10 years and do not assume any terminal value, a conservative assumption. The thought is that after this period the growth rates would converge with the economy growth rates (again a conservative assumption). There is a 26% change in valuations in an example where we take long period growth at 15% vs 20% ie every percentage change in growth results in approximately 5% change in valuations.
Now if we look at growth levels seen in various parts of the market we find that in the period 2008 to 2021, larger caps were the fastest growing part of the market. Large cap index grew earnings at 5% vs 4% for midcaps and 3% for small caps. Higher growth enabled large caps to enjoy better valuations in this period. In fact FMCG index grew earnings at over 2X the growth of Nifty and performed strongly during this period. The earnings leadership has changed from the bottom of Covid. If we look at growth rates of various parts of the market after Covid, we find that mid and small cap indices earnings growth has been significantly more than large caps. The growth rates have been 22%, 36%, 48% for Large, Mid and Small cap indices over FY21 to FY23. While the gap in growth rates has narrowed down in FY24 and may narrow down further going forward, as long as it remains meaningful (we believe it would sustain), theoretically mid and small cap spaces should be able to trade at a premium valuation vs large caps. This would be a change vs historical trading patterns. However, these spaces are less liquid vs large cap space and liquidity risk is higher.
We do believe that the higher earnings growth of mid and small segment should sustain. A significant contributor to the sharp difference in growth trajectory pre and post Covid has been reverse Globalisation and China+1 sentiment. US itself wants to move manufacturing back into the US and is incentivising domestic production. This is enabling our country to also extend incentives/benefits to domestic and MNC businesses to set up a new eco-system (such as the electronics ecosystem, chemical ecosystem, etc) in the country to improve the manufacturing presence in the economy significantly. The presence of manufacturing focussed businesses is higher in the mid and small part of the market and this change is having a large bearing in their fortunes. Similarly growth themes like luxury consumption, hospitals, new tech, engineering and defence, etc are themes which have emerged over the past few years and are more represented in the mid and small cap space. We are growth focussed investors and as a process we have kept our focus on these themes to ensure both good longevity of growth and quantum of growth in our portfolios.
Focus on Risk
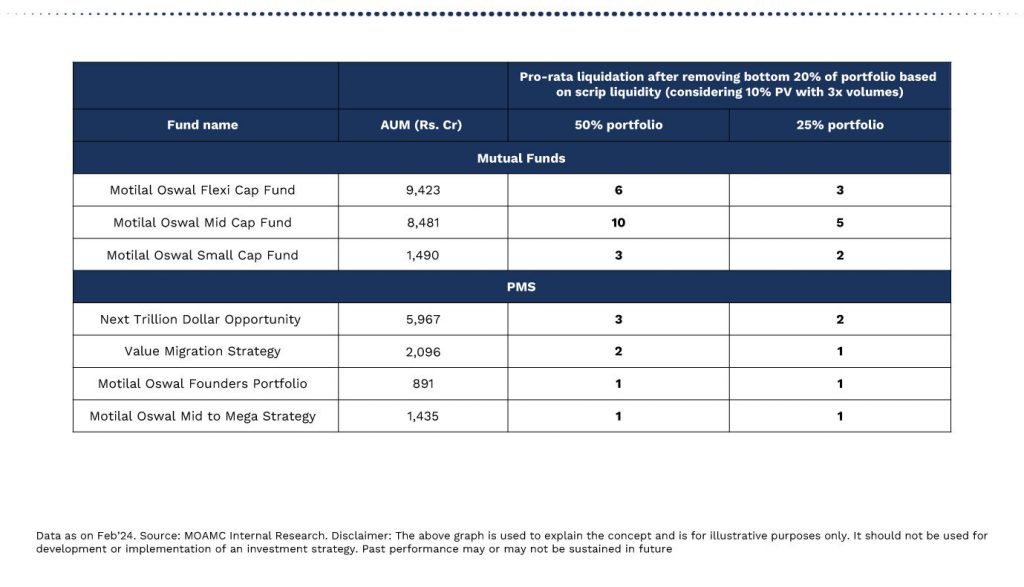
In our past editions we have discussed several risks such as oil prices, geopolitical risks, risk of higher yields sustaining for longer, etc and concluded that, as yet, the risks are within tolerance levels. At this juncture the risk in focus is the valuation risk in the small and midcap space and the illiquidity risk associated with the space. We have tried to address the valuation risk in the section before and concluded that if the growth rates in the small and mid segment sustains at a higher levels, there is a great chance that the space could continue to command premium valuations. The lower liquidity associated with the mid and small cap space is a real risk and some funds in this category have seen strong scale up which is resulting in a concentration risk of another kind (ie what happens if a fund gets large redemption for any reason and the cascading effect the same may have on other funds). As of now, we are less impacted on account of this risk because
- our AUMs are not large and we retain the ability to change names and
- have a very low overlap between our funds and larger funds in the competing category.
While we run focussed high conviction portfolios, we have made sure that our liquidity profile of our funds is, generally speaking, quite competitive with that of the peer-set fund houses.
As we move towards elections and nearer to the full budget, the policy risk around taxation of equity gains would again come into focus.
Our thoughts are as follows:
- tax buoyancy is strong and collections are over the budgeted numbers.
- the lower taxation on FPIs on the F&O part already and the new GIFT city route where even their cash trades/ investments into MFs could potentially attract lower taxes.
- Expectations of higher taxation is to achieve tax convergence with other asset classes. However, convergence should mean fungibility of profits and losses between asset classes and removal of STT on equity trades. These steps would mean that predictability of revenues for the government reduces and overall collections may not increase.
- While collections may not increase, a correction in the equity market to the tune of 7-8% logically (on higher required rate of return) and more on sentiment should be expected.
- Domestic investors have only recently started to come to equities and are providing strength to the markets and enabling start-ups, small and midcaps and large-caps to raise money fuelling economic growth. If these flows are impacted our market would again see higher influence of FPI money as was the case in the past, increasing uncertainties for corporate India. Higher equity flows to corporate India has kept debt to equity healthy this time around vs the 2000-2008 period. Even countries like Japan have provided tax free route to domestic investors to come to equity markets.
We thus believe that equity tax increases, while possible, it does seem to be a lose-all proposition and should be seen to be a low probability event.
How are our portfolios positioned for the new fiscal
We are quality and growth focussed investors. As we had noted in our Jan 1st edition, we believe that the growth themes of FY24 should continue into the future though the drivers may be different as baton passes from the government to the corporates for capex.
We have tried to include all growth themes, where growth in earnings are expected to be in excess of the index earnings growth rates, in our portfolios. In these spaces we have some of the highest earnings growth businesses. We believe this would help our portfolios to participate well with the moves in the market. A large earnings growth delta with competitive valuations is our primary source of alpha.
We believe next fiscal continues to be period for alpha because the growth in the broad market continues to be stronger than the large cap spaces.
In FY25, which is just beginning, we could see regulated interest rates drop in India and in the western economies. Lower interest rates are positive for growth businesses in particular while being generally positive for a growth asset class like equity. We believe that lower interest rates would provide further tailwinds to our portfolios in the new fiscal, over time.
Thank you. Happy Investing
May the Good Times Continue
Prateek Agrawal
Executive Director
Motilal Oswal Asset Management Company Limited
Disclaimer: This article has been issued based on internal data, publicly available information, and other sources believed to be reliable. The information contained in this document is for general purposes only and not a complete disclosure of every material fact. The Stocks/Sectors mentioned herein are for explaining the concept and shall not be construed as investment advice to any party. The information/data herein alone is not sufficient and shouldn’t be used for the development or implementation of an investment strategy. It should not be construed as investment advice to any party. All opinions, figures, estimates, and data included in this article are as of date. The article does not warrant the completeness or accuracy of the information and disclaims all liabilities, losses, and damages arising out of the use of this information. The statements contained herein may include statements of future expectations and other forward-looking statements that are based on our current views and assumptions and involve known and unknown risks and uncertainties that could cause actual results, performance, or events to differ materially from those expressed or implied in such statements. Readers shall be fully responsible/liable for any decision taken based on this article. The graphs used are to explain the concept and are for illustration purposes only and should not use for the development or implementation of an investment strategy. Past performance may or may not be sustained in the future. Investments in the securities market are subject to market risks, read all relevant documents carefully.


