


Emerging Markets have been increasingly grabbing the attention of global investors in the last few years. The consistent growth and evolvement of these markets provide major opportunities and have been attracting significant Foreign Portfolio Investments (FPIs). As recession looms over developed markets, India has become the go to destination for many investors who have been looking to diversify their investment away from China. The strong fundamentals are attracting FPIs to India despite global slowdown.
Exhibit 1: Assets Under Custody since 2012 by FPIs
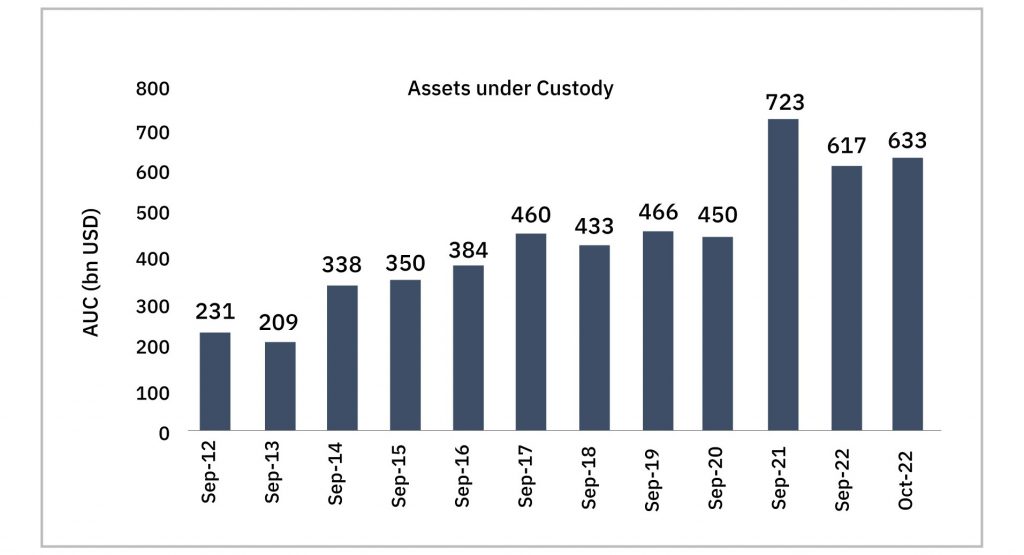
Source- NSDL; Data from September 2012 to October 2012
As shown in Exhibit 1 above, the total Assets Under Custody (AUC) grew from ~USD 231 bn in September 2012 to ~USD 723 bn in September 2021, a CAGR of 12.0%. Monetary tightening by the Fed in 2022 led to FPIs pulling out of India and AUC as of September end fell by ~15%. The AUC showed an uptick in the fortnight ending 31 October 2022 as it increased to ~USD 633 bn.
Exhibit 2: Fortnightly Net Flows since March 2022
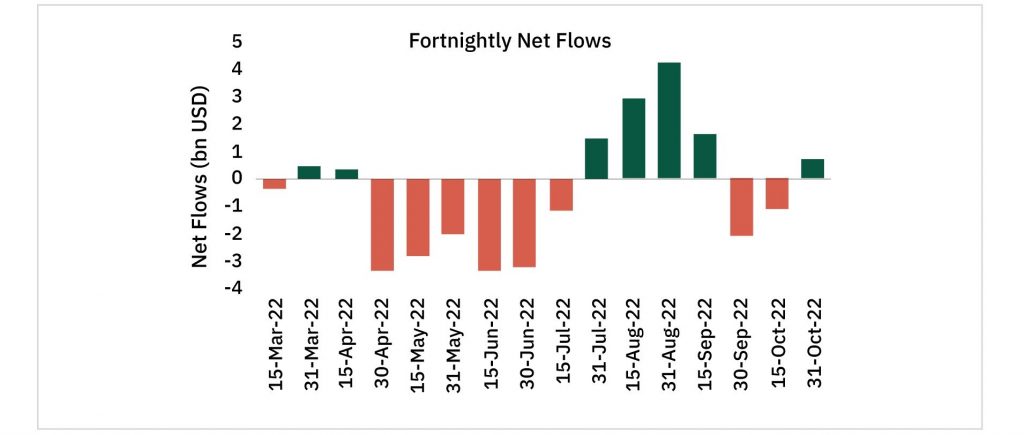
Source- NSDL; Data from March 2022 to October 2022
After remaining net sellers for 6 consecutive fortnights, FPI flows revived slowly. Fortnight ending 31 August witnessed the highest FPI inflows this year. Post that the flows slowed down and turned negative in the past 2 fortnights. Even as recession fears are growing in Developed Markets, investors are turning towards India as FPI flows see an uptick as of October end.
Exhibit 3: Where does most of the FPI flows come from?
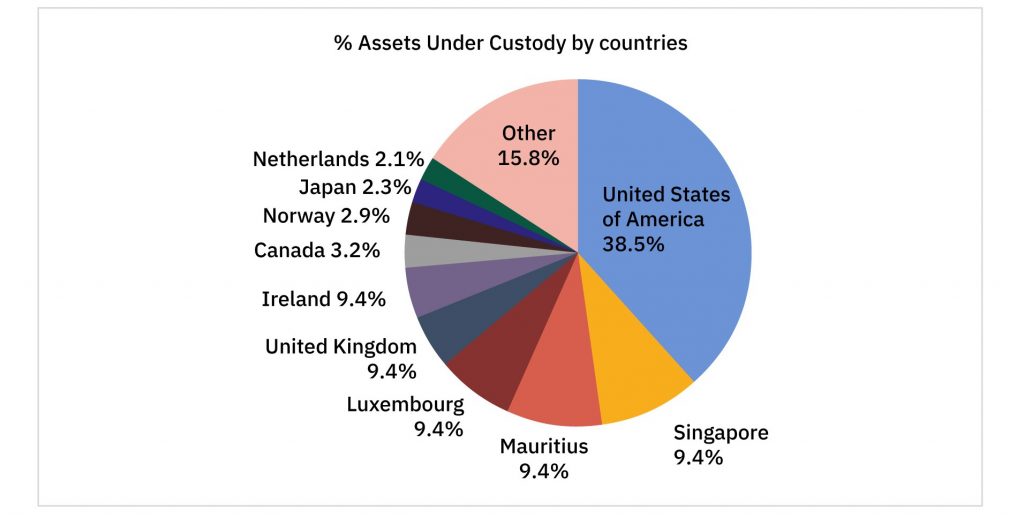
Source- NSDL; Data as of 31 October 2022
As of 31 October 2022, 38.5% of the total FPI investment comes from the USA. Thus, any fluctuation in the US market has a significant impact on the FPI flows to India. In Oct 2022, Singapore overtook Mauritius to become the second largest source of FPI inflows. It is interesting to note that the most debt inflows to India come from Singapore.
Exhibit 4: Sectors attracting the most FPIs
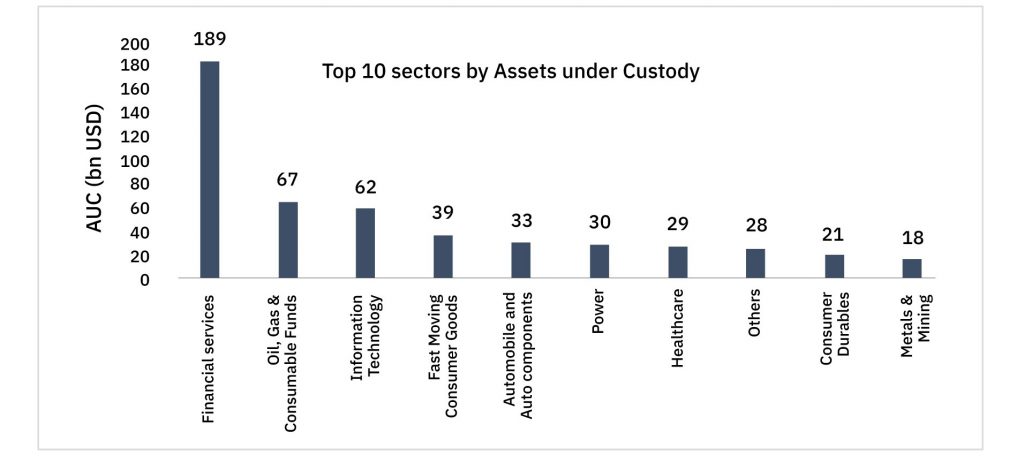
Source- NSDL; Data as of 31 October 2022
FPI investments are significantly skewed towards the Financial Services sector. As of October end, ~30% of the total FPI investment was in the Financial Services sector. It was followed by Oil, Gas & Consumable Fuels (~10.5%) and IT (~10%).
Exhibit 5: Winners and Losers
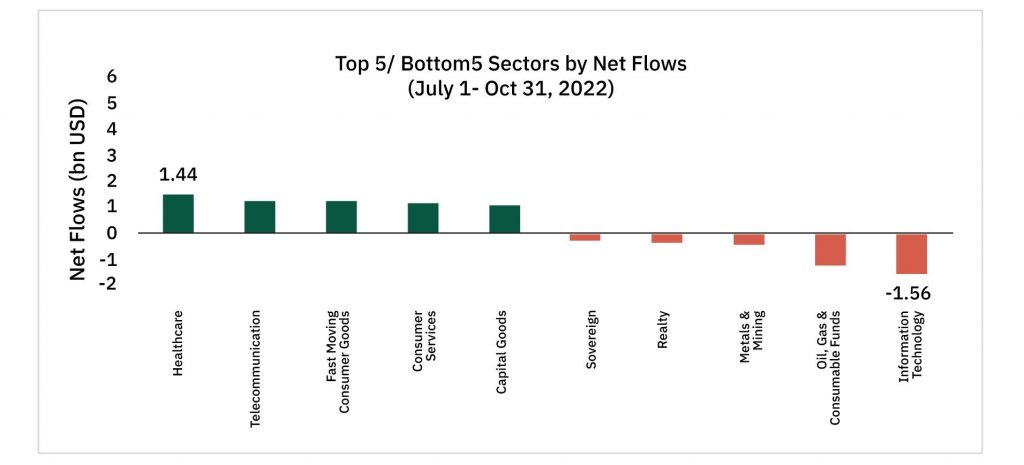
Source- NSDL; Data from 1 July to 31 October 2022
Between July 1- October 31, Healthcare and Telecommunication saw the most inflows, while IT and Oil & Gas saw the most outflows. As the rate hikes by Fed continued, Sovereign bonds too remained in the red.
Exhibit 6: Top sector by Net Flows changing every fortnight
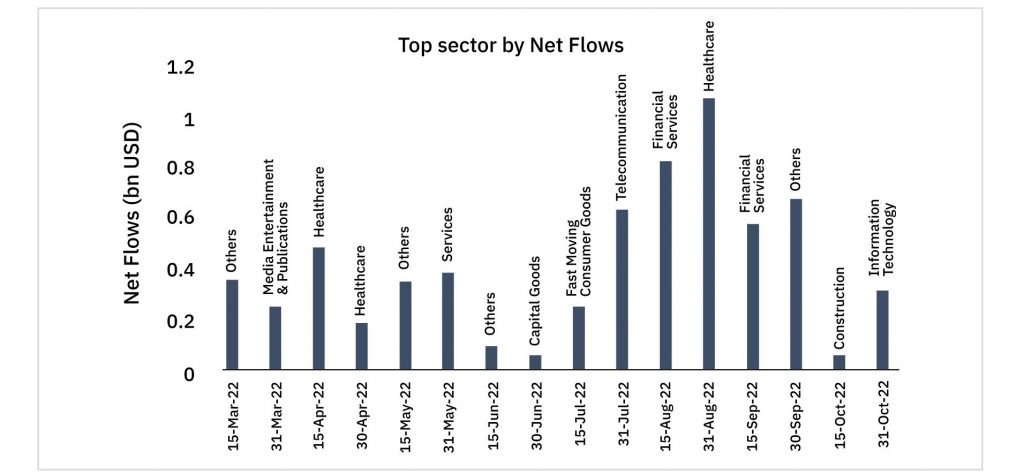
Source- NSDL; Data from March 2022 to October 2022
No one particular sector has consistently drawn the highest FPI investment. FPI flows have changed direction every fortnight this year. It is difficult to predict which sectors would be preferred by FPIs next!
Exhibit 7: Revival of IT sector
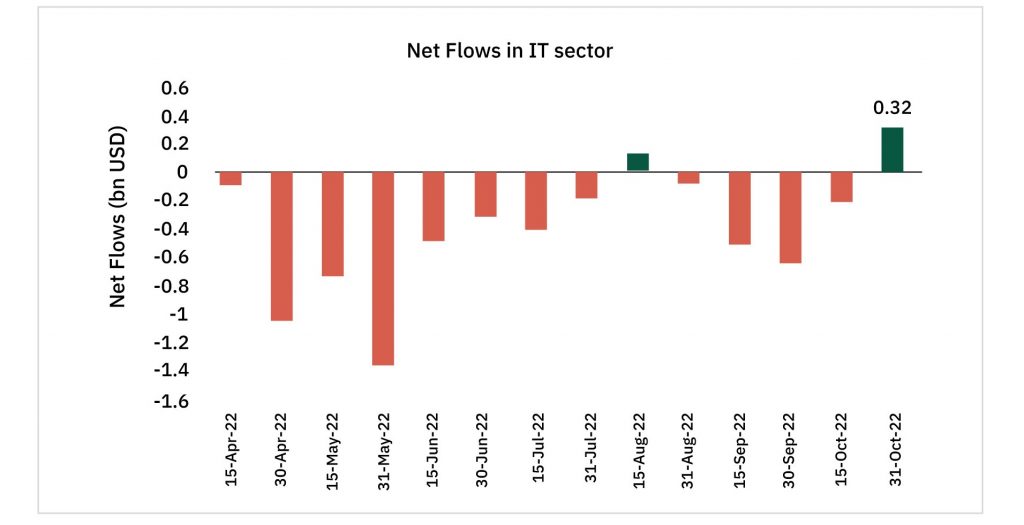
Source- NSDL; Data from April 2022 to October 2022
IT sector is among the top 5 sectors by highest Assets Under Custody. However, steep valuations, high inflation & recessionary fears in Developed Markets led to FPIs dumping tech stocks throughout 2022. Now that the market has corrected significantly, FPIs have started banking on tech stocks as IT sector saw the highest net flows in the latest fortnight. The reversal of FPI flows shows a ray of hope ahead for the IT sector.
Exhibit 8: Continued optimism in Healthcare sector
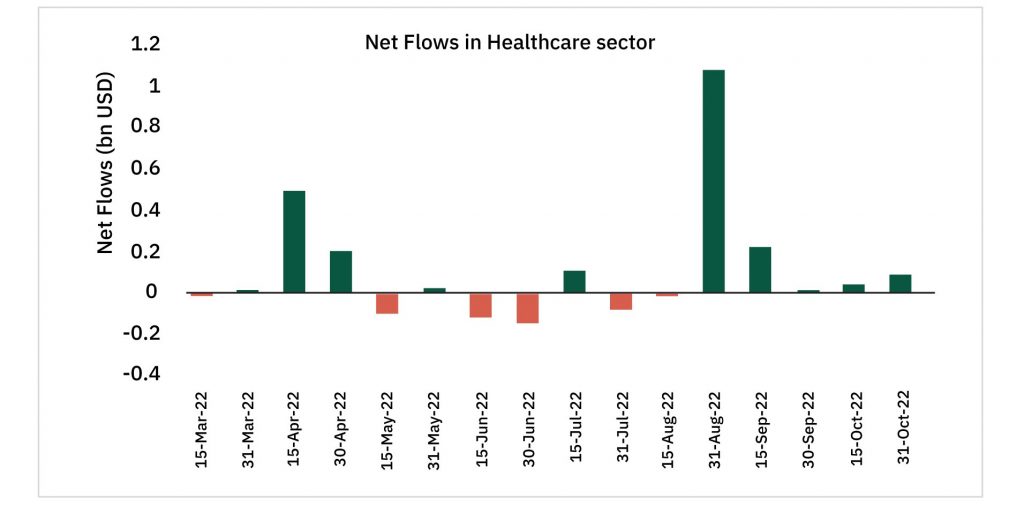
Source- NSDL; Data from March 2022 to October 2022
With increased volatility in the global markets, FPIs seek refuge in defensive sectors like Healthcare. Healthcare was also among the top 5 sectors by net flows as of Oct end.
Exhibit 9: Continued pessimism in Financial Services

Source- NSDL; Data from March 2022 to October 2022
Despite Indian banks reporting healthy financials, FPIs remain bearish on Financial Services sector. Although the quantum of outflows has reduced, the sector still remains in the red. As the Fed slows down rate hikes, net flows may see an uptick in the coming months.
Exhibit 10: Uptick in FMCG sector
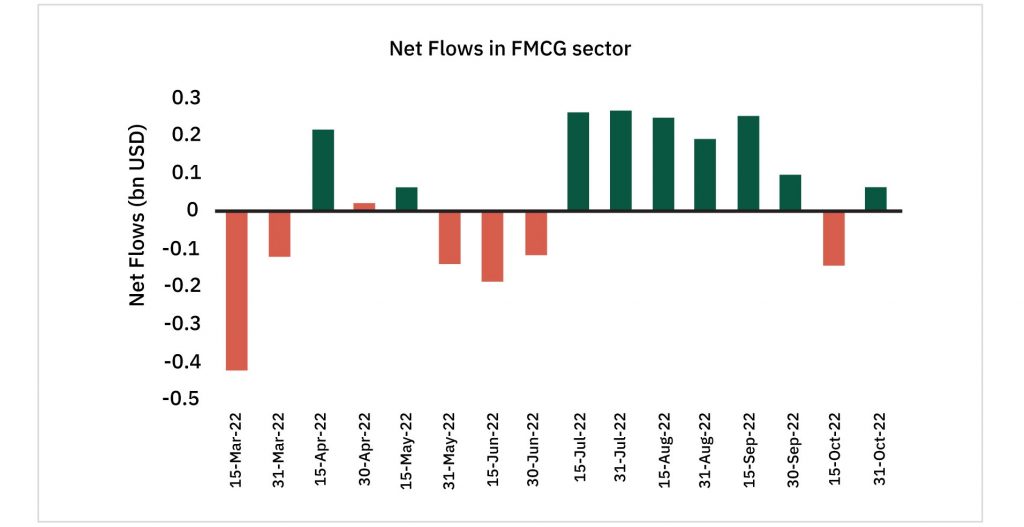
Source- NSDL; Data from March 2022 to October 2022
After consistent positive bets on FMCG stocks since July, FPIs slowed down in the last two fortnights. FMCG sector picked up again in the second half of October and was among the top 10 sectors by net flows despite sluggish rural demand and inflation eating into the sector’s volume growth.
Way forward
In the backdrop of growing inflation and global economic slowdown, markets are expected to be volatile for the foreseeable future and so will be the FPI flows. The revival of IT sector after a long period of net selling is a positive sign for tech stocks that have been on a downward spiral throughout the year. However, it is premature to say that the net flows in the sector will remain positive considering how the flows have changed direction every fortnight. Strong performance of Indian banks is expected to reverse the flows in the Financial Services sector in the coming months. Investors’ confidence in India even during global slowdown and a rising dollar is noteworthy. The upcoming rate hikes and inflationary outlook will be key in determining the direction and quantum of FPIs in India.
This article has been issued on the basis of internal data, publicly available information and other sources believed to be reliable. In Exhibit 5, ‘Others’ sector has not been considered as there is constituent breakup provided for it. The information contained in this document is for general purposes only and not a complete disclosure of every material fact. The indices mentioned herein is for explaining the concept and shall not be construed as an investment advice to any party. The information / data herein alone is not sufficient and should not be used for the development or implementation of any investment strategy. It should not be construed as an investment advice to any party. All opinions, figures, estimates and data included in this article are as on date. The above graph is used to explain the concept and is for illustration purpose only and should not be used for development or implementation of an investment strategy. Past performance may or may not be sustained in future. The article does not warrant the completeness or accuracy of the information and disclaims all liabilities, losses and damages arising out of the use of this information. The statements contained herein may include statements of future expectations and other forward-looking statements that are based on our current views and assumptions and involve known and unknown risks and uncertainties that could cause actual results, performance or events to differ materially from those expressed or implied in such statements. The Stocks/sectors mentioned above are used to explain the concept and is for illustration purpose only and should not be used for development or implementation of any investment strategy. It should not be construed as investment advice to any party. The stocks may or may not be part of our portfolio/strategy/ schemes. Past performance may or may not be sustained in future. Readers shall be fully responsible/liable for any decision taken on the basis of this article. Mutual Fund investments are subject to market risks, read all scheme related documents carefully.


