


India recently crossed the UK to become the 5th largest economy in the world with a per capita income of $2000. The IMF expects the per-capita income to grow at 6% till March 2025 (FY25). At $2000 levels, income crosses the minimum expenditure level & incremental income is used for spending & investments.
Relationship with money
Our relationship with money evolves as we advance in life. Generally, the first generation of any family prioritises survival while the second generation focuses on basic needs like food, shelter & clothes. Once the basics are taken care of, the third generation naturally takes it further & transitions from needs to wants.
India, the youngest country in the world with the largest population and one of the highest number of middle-income households, is experiencing a shift in its relationship with money. This shift is driven by a rise in per capita income and lifestyle improvement, which leads to a demand for bigger houses, cars, and electronics.
A transition from needs to wants is the transition of Old India (previous generation) to New India (current generation). While Old India took solace in investing in physical assets like real estate & gold, the new India is rapidly moving towards financial assets. This can be seen in how the overall household net worth has evolved over period,
Exhibit 1: An Indian household’s net worth in 1991 & 2018
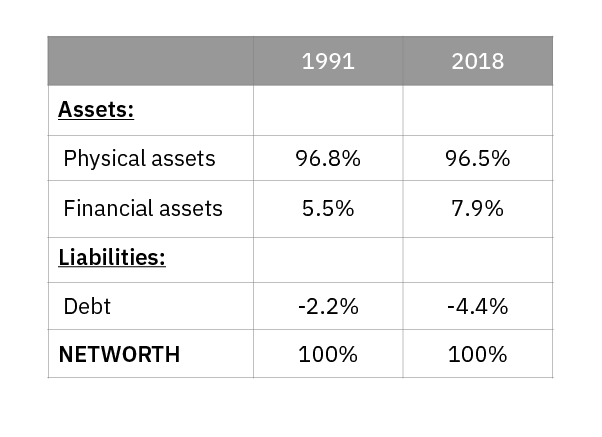
Source: NSS. Latest available data as of Sep 2021
Even though the share of physical assets has largely remained the same, financial assets & liabilities have grown at a much faster rate. Interestingly, debt has almost doubled which may include borrowing for buying a new house, car, or electronic goods reflecting the aspirations of New India.
Evolving savings
Similarly, if we look at how Indians are incrementally investing their saving now, we see a clear trend. Since the last 5 years, a higher share of incremental money is going to financial assets.
The behaviour change was partly boosted by Covid, with more people entering the stock market and focusing on insurance. Regulatory bodies too, have played an impactful role in developing the financial ecosystem & making it more transparent. The shift from needs to wants alongside massive regulatory developments have acted as a catalyst in the growth of financial assets.
A rise in financial assets means increased investor participation in capital markets, credit growth, and increased insurance penetration often termed as ‘financialization of savings’.
Exhibit 2: Breakup of incremental household saving flows
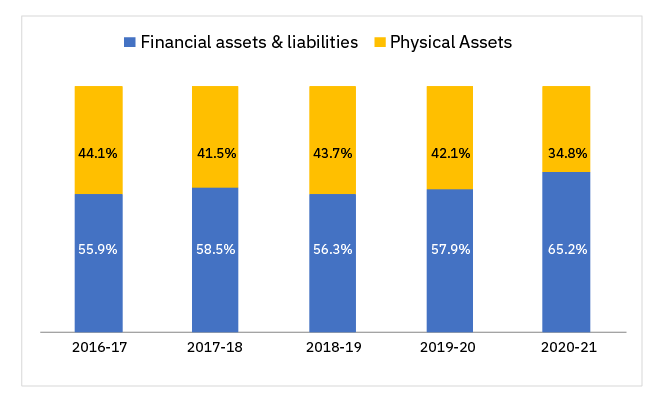
Source: RBI. Latest available data as of Sep 2022
The transition has become more prevalent over the last few years as can be seen in exhibit 2, where incremental flows to financial assets & liabilities have increased from 56% in March 2017 (FY17) to 65% in March 2021 (FY21). At the same time, the share of physical assets fell from 44% in FY17 to 35% in FY21.
Move over Bank Deposits
Exhibit 3: Breakup of savings in financial assets of Indian Households
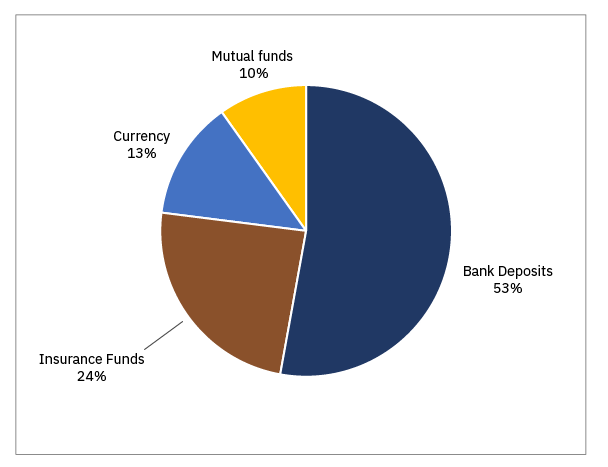
Source: RBI. Latest available data as of Sep 2022
Unsurprisingly, bank deposits comprise the majority (>50%) of the portion in financial assets, followed by cash, life insurance & mutual funds. However, within financial assets, managed investment solutions like MF, Pension & Insurance are growing faster than bank deposits as more & more investors are looking for products with higher post-tax yields.
Since 2017, financial assets (other than bank deposits) have grown at a much faster pace of 16% from ₹63 to ₹135 lakh core compared to bank deposits which have grown at a CAGR of 10%. Crisil MI&A Research expects the financial assets to reach ₹315 lakh crore in FY27 from the current ₹135 lakh crore, implying a CAGR of 18% in the next five years.
Exhibit 4: Growth of financial assets vs Fixed Deposits
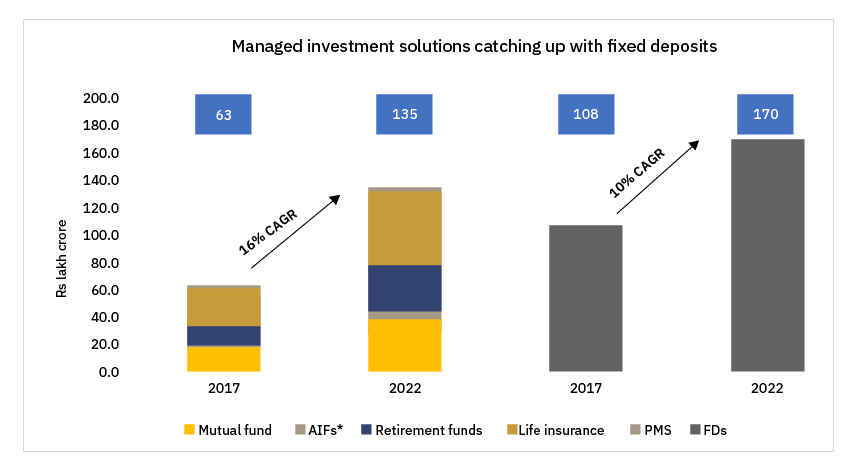
Source: CRISIL. Data as of December 2022.
The rapid growth in investment & credit solutions acts as a tailwind for the financial sector particularly companies operating in capital markets, insurance, and credit businesses. To participate in the growth of financial assets (other than bank deposits), S&P BSE Financials ex Bank 30 Index helps investors gain exposure to the financialisation of savings theme by including non-banking financial companies that are in the business of capital markets, lending & insurance. These businesses include the country’s leading life & general insurers, NBFCs that provide consumer finance & capital market companies from exchanges to AMCs to brokers as well as new & emerging businesses like Fintech. The index has returned 14.5% CAGR in the last 10 years. The below exhibit shows the index composition breakup. Interestingly, NBFCs (including Housing finance companies) & Life Insurers make up more than two-thirds of the index.
Exhibit 5: S&P BSE Financials ex Bank 30 Index Basic Industry breakup
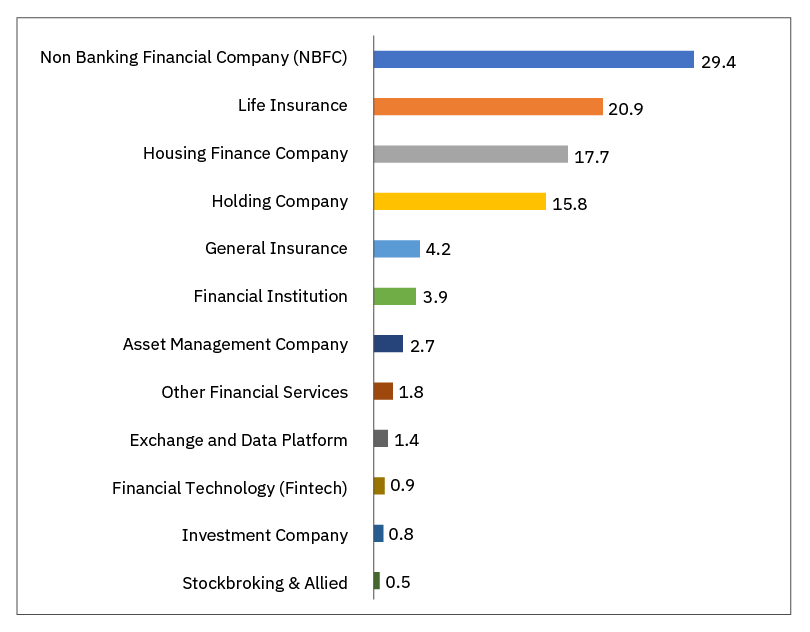
Source: S&P BSE. Data as of December 2022.
Financial Services Boom – The stage is set
Currently, India has an urban population of ~35%, which is set to grow to 50% by 2050. Increasing urbanisation is likely to aid high consumer aspiration. As per-capita income & urban population grows, the middle-class population will also grow. Crisil expects middle-class households in India to grow from 4.1 Cr in 2012 to 18.1 Cr by 2030, which is 1.5 times the number of households in the US.
A combination of a growing middle class, high aspiration & increasing income levels is a favourable combination for the ‘financialisation of savings’ theme as it will continue the momentum of high credit growth, increasing insurance coverage and investor participation in capital markets. The financial services sector will likely reap most of the benefits from such a shift and S&P BSE Financials ex Bank 30 Index helps investors benefit from such a theme.
Disclaimer: IMF, CRISIL, World Bank, MOHUA. The above graph/table is used to explain the concept and is for illustration purpose only. It should not be used for development or implementation of any investment strategy. Sectors – Macro Economic Sectors as per AMFI Industry Classification. The stocks/sectors mentioned above are used to explain the concept and is for illustration purpose only and should not be used for development or implementation of an investment strategy. The stock may or may not be part of our portfolio/strategy/ schemes. It should not be construed as investment advice to any party. Past performance may or may not be sustained in future. This article has been issued based on internal data, publicly available information and other sources believed to be reliable. The information contained in this document is for general purposes only and not a complete disclosure of every material fact. The indices mentioned herein are for explaining the concept and shall not be construed as investment advice to any party. The information/data herein alone is not sufficient and should not be used for the development or implementation of any investment strategy. It should not be construed as investment advice to any party. All opinions, figures, estimates and data included in this article are as of date. The article does not warrant the completeness or accuracy of the information and disclaims all liabilities, losses and damages arising out of the use of this information. The statements contained herein may include statements of future expectations and other forward-looking statements that are based on our current views and assumptions and involve known and unknown risks and uncertainties that could cause actual results, performance or events to differ materially from those expressed or implied in such statements. Readers shall be fully responsible/liable for any decision taken based on this article. Mutual Fund investments are subject to market risks, read all scheme related documents carefully.
This article was covered by The Live Mint on 12th March 2023
The evolution of financial services and savings trends in India | Mint (livemint.com)


