


We all have repeatedly come across those big technology companies like Meta, Apple, Microsoft, etc. have become too big and take significant weight in the broad market indices. One of the most famous analogies is that Apple’s m-cap exceeds most countries’ GDP! Post Covid-19 bull run, many market participants have formed an opinion that the market returns are driven by a handful of stocks/sectors, representing a more significant percentage of the overall capitalization of the equity market.
Let us first see the Cumulative weight of the top 10 stocks across the history of the S&P 500 index.
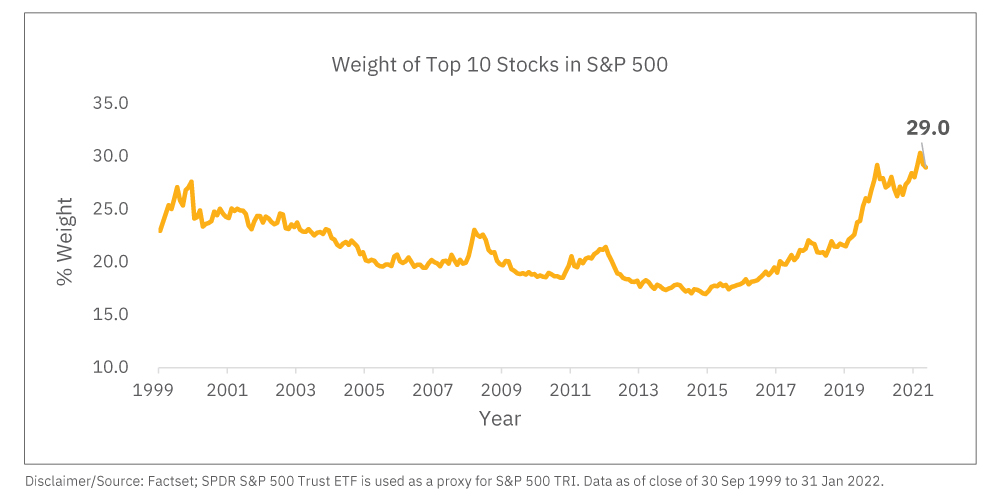
We can observe that the top 10 stocks account for a large percentage of the index, with the latest reading being very close to the all-time high of ~30% for the last two decades. This observation makes for a catchy headline, but we need to understand a few caveats: Whether the market returns are concentrated or actually broad-based? Does market concentration have any relation with the forward returns of the index?
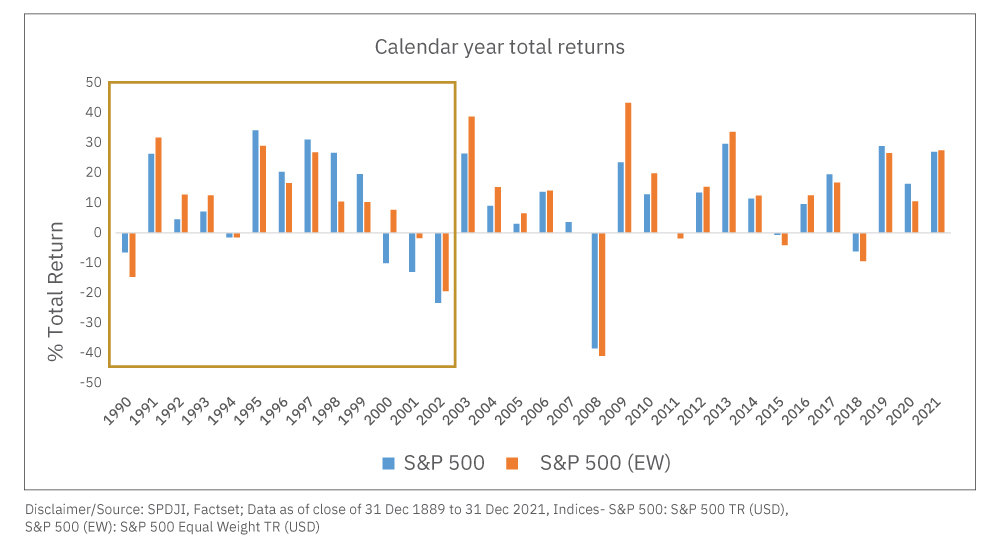
Let’s dig in! Comparing Performance of the equal-weighted index of the S&P 500 with the market-cap-weighted index, we can see whether the returns have been broad-based or not. So basically, we are using S&P 500 equal-weighted index as a proxy to see whether market returns are broad-based or not.
The graph below tells us that the market returns were much more skewed till the dot-com bubble era (as highlighted). However, in the last ~20 years, we can see that the S&P equal-weighted index has either risen/fallen more than the market-cap-weighted index, which suggests that the returns have been more broad-based than a few stocks contributing to the return in S&P 500.
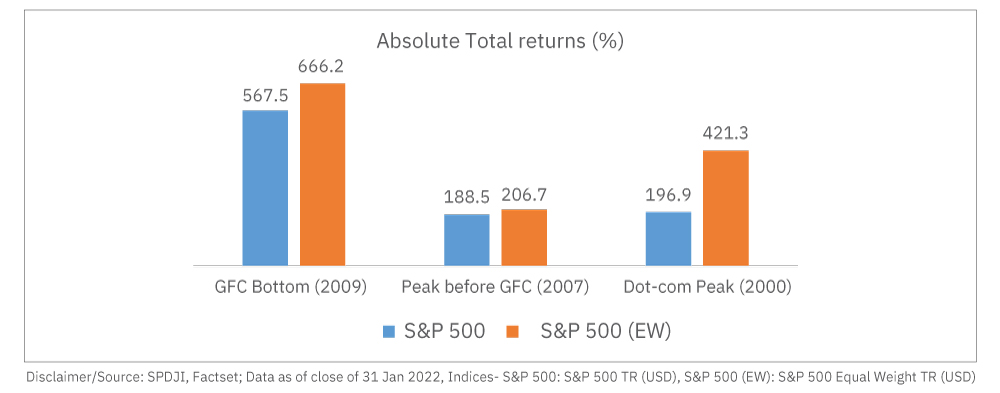
A similar comparison (as shown below) between the market-cap-weighted and equal-weighted index total returns of the S&P 500 over different periods supports the argument that a few key stocks have not driven the bull market. Since the bottom of GFC in 2009, the equal-weight index has outperformed the market-cap-weighted index. We have also included the performance from two market peaks to remove the starting period bias or the base effect. There seems to be no evidence of market concentration.
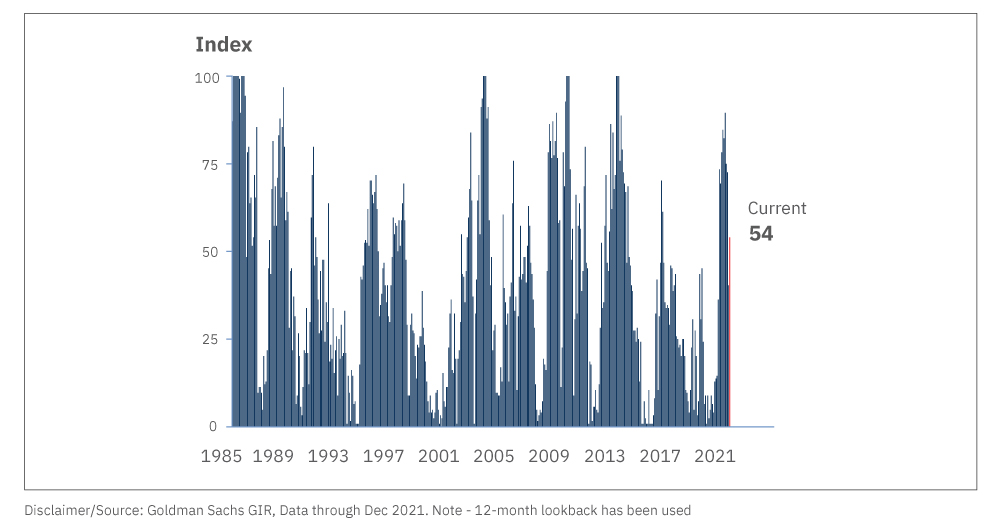
Goldman Sachs closely monitors a measure called “breadth,” which assesses the degree to which a small handful of stocks is driving the market’s returns. We can see that the market breadth has been well above the average over the last 12 months.
After seeing that index returns might not be as concentrated as one would guess, let us answer the looming question of whether there is any power of market concentration to estimate the forward returns? We analyzed the data for the past 20 years, and below is the summary:
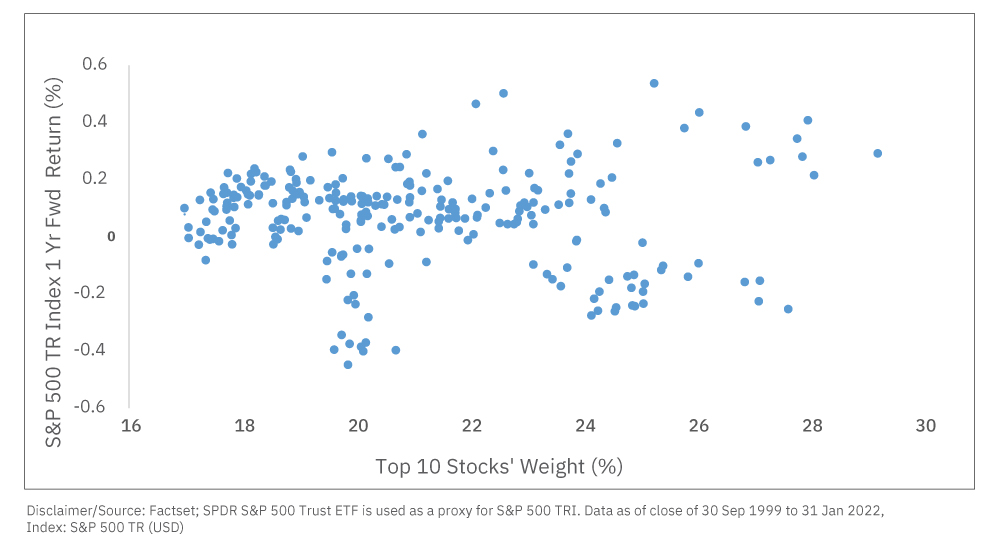
The x-axis on the above chart shows the sum of the weight of the top 10 stocks in the S&P 500 Index at every month-end for the past 20 years. The y axis shows the 1-year forward index total returns starting each month-end for the same period. We ran a linear regression and found the coefficient of determination (R2) zero.
Conclusion
The above means that market concentration has no explanatory power to describe forward returns. The correlation between the market concentration and the forward returns has been 0%. It also busts a common misconception that higher/lower the concentration in the index, higher/lower the index returns in the future. We can put our minds to rest and conclude that the index concentration has no significance to the returns that the index fund will deliver in the future.
Disclaimer: This article has been issued based on internal data, publicly available information and other sources believed to be reliable. The information contained in this document is for general purposes only and not a complete disclosure of every material fact. The stocks/sectors mentioned herein explain the concept and shall not be construed as investment advice to any party. The information/data alone is insufficient and shouldn’t be used to develop or implement any investment strategy. It should not be construed as investment advice to any party. All opinions, figures, estimates and data included in this article are as of date. The article does not warrant the completeness or accuracy of the information. It disclaims all liabilities, losses and damages arising out of the use of this information. The statements contained herein may include statements of future expectations and other forward-looking statements based on our current views and assumptions and involve known and unknown risks and uncertainties that could cause actual results, performance or events to differ materially from those expressed or implied in such statements. Readers shall be fully responsible/liable for any decision taken based on this article. Mutual Fund Investments are subject to market risks; read all scheme related documents carefully


