


Overview:
Since the start of 2022, the capital markets have been quite volatile, with the Nifty 50 down by ~16.5% from peak to bottom[1]. Moreover, it has been raining with global macro-economic events such as higher inflation, the Russia-Ukraine war, China lockdown, and rate hikes, which have left much uncertainty among the market participants.
During such turbulent times, investors often look for investment solutions, which may help reduce the heightened volatility.
The low volatility strategy:
Among several factor-based investing strategies, the low volatility factor includes stocks with historically stable price movement. Further, this strategy selects companies with relatively mature business models and stable earnings visibility.
Most investors suffer from loss aversion bias, i.e. the pain of losing is twice as more as the pain of winning. Therefore, in times of market free-falls, the low volatility strategy may help to decrease the magnitude of the fall. In addition, having a low volatility strategy’s support may also minimize the panic decisions made during the high drawdown phase.
Recent Performance of the low volatility strategy:
Let us see how the low volatility strategy fared against the Nifty 200(herewith referred to as “markets”).
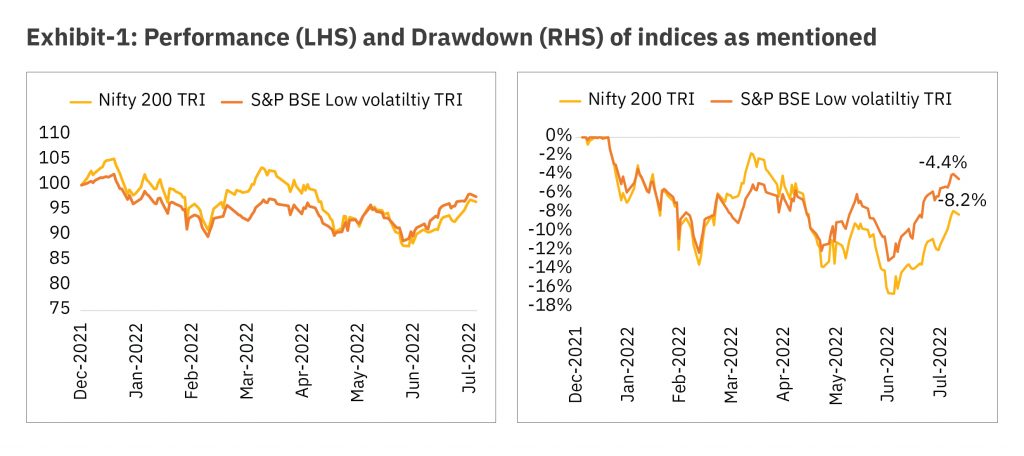
Disclaimer/Source: MOAMC, niftyinces.com, Asiaindex; Data as of 25 July 2022. The above graph is used to explain the concept and is for illustration purpose only and should not used for development or implementation of an investment strategy. Past Performance may or may not be sustained in future.
The YTD returns for the low volatility strategy stand at -2.3%, while that of the market is at -3.3%, i.e. an outperformance of 1%. The former outperformance may not seem much; however, the maximum drawdown faced by the low volatility strategy during this time has been -13% against -16.5% of the market. This is an outperformance of 3.5%. The data puts the proof in the pudding and demonstrates that the low volatility strategy is performing as expected from its characteristics.
Nevertheless, it is interesting to see why the low volatility strategy falls lesser than the market. A quick look at the strategy’s composition will tell us which sectors/stocks have the most significant representation in the strategy index.
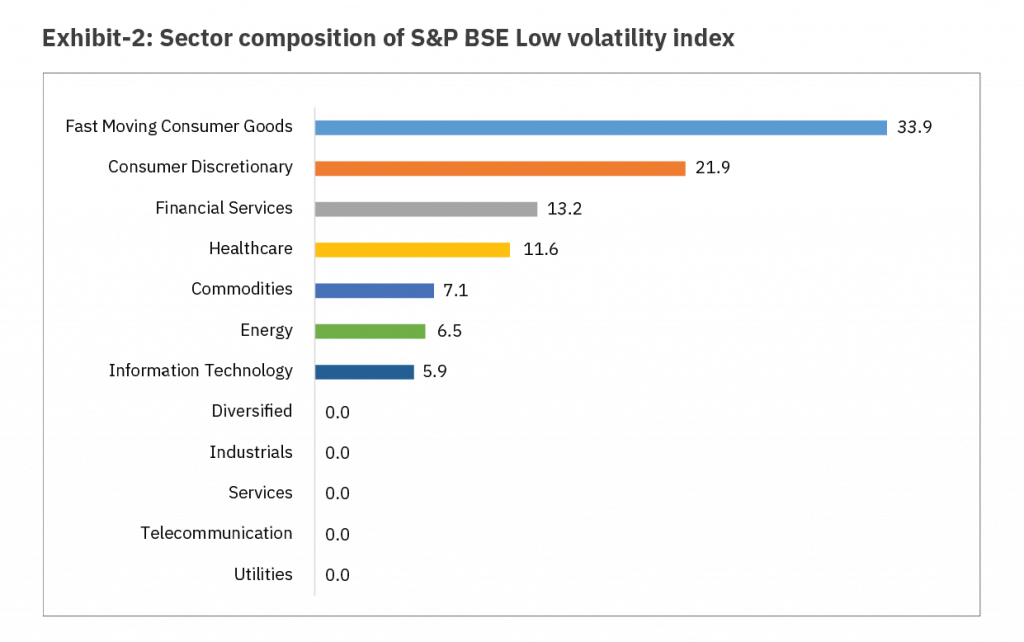
Disclaimer/Source: S&P BSE; Data as of 30 June 2022 . The sector mentioned herein are for general assessment purpose only and not a complete disclosure of every material fact. It should not be construed as investment advice to any party. Past Performance may or may not be sustained in future.
Let’s look at the top sectors by weight. Defensive sectors such as FMCG and Consumer Discretionary occupy the lion’s share, i.e. 34% and 22.5%, respectively. These sectors generally exhibit inelasticity towards high prices and get less impacted. Conversely, cyclical sectors such as industrials and commodities are absent or occupy little weight in the index protecting it from steep falls.
We saw above that the low volatility strategy fell lesser than the markets in 2022, but was it the case during the past market falls as well.
Turning the pages into history
Let us analyze how did the low volatility strategy fare during different levels of market falls. Here, we put the strategy through the test of time to determine whether it stands out.
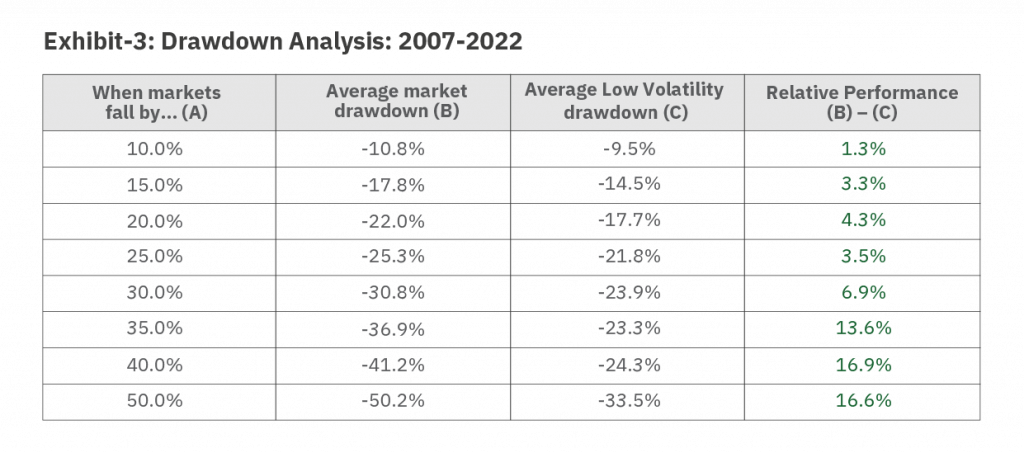
Source: MOAMC, niftyindices.com, S&P BSE; Data as of 25 July 2022; Markets – Nifty 200 TRI, Low volatility – S&P BSE Low Volatility TRI The above table explains the concept, is for illustration purposes only, and should not be used to develop or implement an investment strategy. Note that the assumptions listed above are central to the illustration.
In the table above, Column (B) shows the average drawdown of markets each time it fell by X%, i.e. mentioned in column (A). Similarly, column (C) shows the average drawdown of the low volatility strategy during the same period.
We can observe that the low volatility strategy outperformed the broader markets at each market fall. Further, we see an exciting trend that as markets fall deeper, the outperformance of the low volatility strategy against the market also increases. For example, at 20% market drawdown, the outperformance by low volatility is ~4%, but at 35% market drawdown, the outperformance jumps to ~14%. This shows that the low volatility strategy has also behaved as expected in the past.
The low volatility outperformance stems from several behavioural biases of investors, such as the lottery effect, overconfidence bias and asymmetric nature of returns.
Conclusion:
As observed above, with sufficient historical data and empirical evidence, we can see the presence of the low volatility anomaly in the market. The low volatility strategy exploits human behavioural biases to limit the downside risk. So, essentially, the strategy falls less so that it doesn’t have to rise as much to outperform the markets. Exposure to such a strategy can help you sail through market falls more smoothly.
This article was covered by The Economic Times’ on 31st July 2022
Disclaimer:This article has been issued on the basis of internal data, publicly available information and other sources believed to be reliable. The information contained in this document is for general purposes only and not a complete disclosure of every material fact. The Stocks mentioned herein is for explaining the concept and shall not be construed as an investment advice to any party. The information / data herein alone is not sufficient and shouldn’t be used for the development or implementation of an investment strategy. It should not be construed as investment advice to any party. All opinions, figures, estimates and data included in this article are as on date. The article does not warrant the completeness or accuracy of the information and disclaims all liabilities, losses and damages arising out of the use of this information. The statements contained herein may include statements of future expectations and other forward-looking statements that are based on our current views and assumptions and involve known and unknown risks and uncertainties that could cause actual results, Performance or events to differ materially from those expressed or implied in such statements. Readers shall be fully responsible/liable for any decision taken on the basis of this article. Mutual Fund investments are subject to market risks, read all scheme related documents carefully.


